Singapore
Commentary on URA Q1 2024 statistics - Office, Retail and Residential
April 26, 2024
Associated Contact
Head of Marketing & Communications, Singapore

Office
• URA Office rental index declined in Q1 2024, after rising for nine straight quarters since Q3 2021. The URA office rental index (Central Region) declined by 1.7% q-o-q in Q1 2024, a reversal from the 0.3% increase in the previous quarter. CBRE Research believes this reflects the mixed sentiment in the market where there are still uncertainties in the macro environment coupled with ongoing office transformations. According to URA, office rents have been on the rise for 9 consecutive quarters since Q3 2021, with a cumulative increase of 25.3% attributed to a tight supply and low vacancy environment. According to CBRE Research data, vacancies in the core CBD remained low at about 3.6% as of Q1 2024 and Grade A rents have continued to move up, albeit marginally.
• Focusing on rentals of Category 1 office buildings (a proxy for prime CBD) by URA, median rental (by contract date) also experienced a decline of 1.3% q-o-q in Q1 2024. The decrease in average rentals could have been influenced by leases for office spaces of >10,000 sq. ft. However, it is worth noting that smaller spaces of sizes below 10,000 sq. ft. in the Central Area are still witnessing an upward trend in median rents, with a quarterly increase of 8.0% to $12.09 psf/month. CBRE Research notes that most lease renewals are currently transacting at higher rates due to limited supply, elevated interest rates and increased capital expenditure. In addition, the sustained growth in Category 1 rents also positively influenced Category 2 rents which rose 0.7% q-o-q in Q1 2024.
Table 1: Median rentals based on contract date
|
|
Category 11 |
Category 22 |
||||
|
|
Rents ($ psf/month) |
Q-o-q |
Vacancy |
Rents ($ psf/month) |
Q-o-q |
Vacancy |
|
Q1 2023 |
$10.77 |
0.2% |
10.9% |
$5.80 |
1.8% |
11.4% |
|
Q2 2023 |
$11.49 |
6.7% |
9.2% |
$6.19 |
6.7% |
11.5% |
|
Q3 2023 |
$11.22 |
-2.3% |
8.0% |
$5.91 |
-4.5% |
10.9% |
|
Q4 2023 |
$11.52 |
2.7% |
7.5% |
$6.04 |
2.2% |
11.0% |
|
Q1 2024 |
$11.37 |
-1.3% |
7.9% |
$6.08 |
0.7% |
10.3% |
2 Refers to the remaining office space in Singapore which are not included in “Category 1”.
Source: URA
• According to URA data, there was a removal of stock of -0.44 mil sq. ft. It can be attributed to the removal of several buildings, including Central Square and Central Mall, which are scheduled for redevelopment, coupled with the fact that there is no fresh supply in the market. Excluding such demolitions, the market experienced positive net absorption of 0.34 mil sq. ft. This led islandwide vacancies to go down from 9.9% in Q4 2023 to 9.6% in Q1 2024.
• CBRE Research observed that movements in the market are initiated by workplace transformations which are driven by strategic relocations, and most often, flight to quality. This was keenly seen in the private wealth asset management, insurance and legal sectors. Conversely, sectors like traditional banking, technology, and agile space operators have adopted a more conservative stance this quarter, mitigating some of the rental increase pressures. While the resurgence in global layoffs may point to some market volatility, Singapore’s shadow spaces have been relatively stable from Q4 2023, standing at about 0.2 mil sq. ft.
Outlook
• Moving forward, the market could face a slower first half with an above historical average completion pipeline in 2024 and potential secondary spaces, which could lead to a temporary increase in the availability of spaces.
• With still-high interest rates, businesses are likely to remain cautious in their spending and investment plans in the near term. The upcoming completions offer occupiers a good choice of office space and landlords may be more flexible with rents to enhance occupancy. With the economy expected to improve in H2 2024 and occupiers’ continued focus on flight to quality, CBRE Research maintains its previous forecast of Core CBD (Grade A) rents to grow by 2% - 3%.
Retail
• Retail indicators such as the retail sales index showed mixed performance in Q1 2024, likely due to the difference in timing of Chinese New Year in 2023 and 2024. Retail sales (excluding motor vehicles, in chained volume terms) for Jan 2024 declined by 3.0% y-o-y while that in Feb 2024 grew by 7.9% y-o-y.
• URA’s Q1 2024 data showed that rents of retail space in the Central Region fell marginally by 0.4% q-o-q, extending the decline of 0.1% q-o-q the previous quarter. CBRE Research observes that the retail market continues to be two-tiered, with secondary locations seeing softer demand compared to prime spaces which continued to witness strong demand in Q1 2024. As a result, islandwide prime floor rents increased by 1.0% q-o-q, extending the rise of 1.2% q-o-q the previous quarter.
• Retailers remained optimistic about the Chinese New Year festive season and consumer spending upon the disbursement of CDC vouchers. Thus, Q1 2024 bucked the trend of negative net absorption in the first quarter for the past five years. According to URA data, the islandwide private retail market experienced positive net absorption of 5,000 sq. m. (about 54,000 sq. ft.), extending the positive net absorption of 69,000 sq. m. (about 743,000 sq. ft.) in Q4 2023. As a result, islandwide private retail vacancy rates fell from 6.7% in Q4 2023 to 6.6% in Q1 2024, the lowest vacancy rate since Q4 2014’s 6.5%.
• Similar to the previous quarter, the fringe and Orchard areas outperformed the rest of the submarkets in Q1 2024 in terms of net absorption. Private retail space in the fringe area saw positive net absorption of 4,000 sq. m. (about 43,000 sq. ft.). However, with a net increase in stock of 4,000 sq. m. (about 43,000 sq. ft.), likely due to the completion of iMall, vacancy rates remained at 6.7% in Q1 2024.
• The Orchard private retail submarket also saw positive net absorption of 4,000 sq. m. (about 43,000 sq. ft.), bringing vacancy rates down from 8.7% in Q4 2023 to 6.4% in Q1 2024, the lowest since the onset of the pandemic. Q1 2024 tourist arrivals surged by 49.6% y-o-y, bolstered by a five-fold increase in Chinese visitors. The sustained increase in tourist arrivals could have spurred retailers to take up space in the submarket.
• There was a negative net absorption of -5,000 sq.m. (about 54,000 sqft) in the OCR private retail, probably with consolidations in selected trade sectors and resistance to high rents. Vacancy rate increased from 3.9% in Q4 2023 to 4.4% in Q1 2024.
• CBRE Research believes that prime floor rents have continued to recover alongside tourism recovery and the Chinese New Year festive season in Q1 2024. Anecdotally, CBRE Research notes that demand was primarily driven by F&B operators and services such as Paris Baguette, Twyst, Raylite Optical and Erabelle. New-to-market brands continued to proliferate in the quarter, including Mashi No Mashi, Warabimochi Kamakura, Salomon and Fur A Vetreska Pet Store.
Outlook
• While there are a plethora of new shops opening, there are also many closures and consolidations as retailers face manpower shortage, competition from e-commerce and higher operating costs, exacerbated by the ongoing Red Sea attacks. Nonetheless, tourism recovery boosted by the strong pipeline of MICE events and sell-out concerts should support demand for prime retail spaces. Coupled with below-historical-average supply over the next few years, CBRE Research expects overall prime retail rents to continue recovering in 2024.
Residential
Rentals of private residential properties fell for a second consecutive quarter in Q1 2024 on the back of abundant completions in 2023. Rents are still 52.1% above last pandemic-low in Q3 2020. We expect private home rents to ease 1-3% in 2024, led by the CCR properties as vacancy remains elevated and substantial completions in 2024.
Private housing prices continued to rise in Q1 2024, up 1.4% qoq, albeit slowing from the 2.8% increase in Q4 2023. The quarter’s increase was led by the prime non-landed market which rose 3.4% y-o-y, while the suburban and city fringe markets grew at a marginal pace of 0.2% and 0.3% respectively. We expect prices to rise 3-4% in 2024. Prices are unlikely to correct significantly due to resilient household balance sheets and low unsold inventory. That said, the unsold inventory has started to inch up due to slower developer take-up, albeit still below historical average levels.
Overall, private home prices have run up 34.3% since the onset of COVID-19, mainly driven by locals’ pent-up demand and the slower completions over 2020-2022. There have been signs of increasing resistance to high price points amid higher interest rates and the punitive 60% ABSD for foreigners effective late April 2023. This led to full year 2023 developer sales coming in at 6,421 units, a 15-year low. While we saw the there is still good demand for well-priced and well-located projects in Q1 2024, buyers are highly selective and price sensitive. We expect developer sales to remain soft in the near term amid macroeconomic uncertainties, but could pick up towards end of the year, if interest rates stabilise and the economy shows a convincing recovery. We maintain our forecast of a full year 2024 new home sales of 7,000 – 8,000 units.
Private home prices rose 1.4% q-o-q in Q1 2024, marginally lower than the initial flash estimate of 1.5% and moderating from the 2.8% q-o-q increase in Q4 2023. Price growth was mainly underpinned by landed properties which posted a 2.6% q-o-q increase albeit slowing from Q4 2023’s 4.6% q-o-q rise. Growth momentum in the non-landed segment moderated as well to 1% q-o-q from 2.3% q-o-q in Q4 2023.
The increase in prices of non-landed properties was driven by properties in the CCR where prices rose by 3.4% q-o-q in Q1 2024. Overall growth in non-landed properties, however, was held back by subdued price increases in the RCR and OCR which recorded 0.3% and 0.2% q-o-q rises in Q1 2024 respectively.
• During the quarter, the public launch of Watten House in the CCR appeared to have boosted sentiment in the segment, with existing projects such as Perfect Ten and Leedon Green seeing transactions at higher median prices.
• In the RCR, the only new launch was The Arcady at Boon Keng, which sold 29% of its 172 units at a median price of S$2,574 psf in Q1 2024.
• In the OCR, new project launches in the Lentor area, Lentoria and Lentor Mansion had been priced competitively, in view of the abundant supply, while the new launch in January, Hillhaven, was also competitively priced at a median price of S$2,067 psf.
|
Project name |
Tenure |
Market segment |
Units sold |
Median Price ($psf) |
% Of project sold to date* |
|
LENTOR MANSION |
99y |
OCR |
408 |
$2,269 |
76.50% |
|
HILLHAVEN |
99y |
OCR |
79 |
$2,067 |
23.20% |
|
LENTORIA |
99y |
OCR |
60 |
$2,129 |
22.50% |
|
THE BOTANY AT DAIRY FARM |
99y |
OCR |
59 |
$2,019 |
81.90% |
|
THE ARCADY AT BOON KENG |
FH |
RCR |
50 |
$2,574 |
29.10% |
|
LENTOR HILLS RESIDENCES |
99y |
OCR |
48 |
$2,112 |
82.90% |
|
HILLOCK GREEN |
99y |
OCR |
43 |
$2,169 |
40.70% |
|
THE MYST |
99y |
OCR |
42 |
$2,161 |
55.40% |
|
PINETREE HILL |
99y |
RCR |
34 |
$2,459 |
40.00% |
|
THE LANDMARK |
99y |
RCR |
31 |
$2,807 |
90.70% |
*Sales status based on caveats from Realis as of 26 Apr 2024.
• New home sales remained muted in Q1 2024 despite a pickup in launches amid the Chinese New Year seasonal lull and uncertain economic conditions. The quarter saw six new launches and 1,304 newly launched units (excl. ECs), 23% more than 1,060 units launched in Q4 2023. Correspondingly, 1,164 new private homes (excluding ECs) were sold in Q1 2024, a marginal 6.6% higher than the 1,092 units moved in Q4 2023, but 7.3% lower than Q1 2023’s 1,256 units.
• Though new home sales more than quadrupled month-on-month in March, buyers are more selective amid more choices and high price points. Selected projects with superior attributes at realistic price points outperformed while overall sales remained tepid. This could be attributed to weaker economic conditions, buyer fatigue and increasing resistance to high price points. Foreigner buying remains subdued since the doubling of ABSD to 60% in Apr 2023.
• Slower activity was observed in the resale market. 2,689 resale units were transacted in Q1 2024, down by 5% from Q4 2023’s 2,831 units. Resale transactions made up 63.6% of total transactions in Q1 2024, a lower proportion than 65.3% in Q4 2023 on higher new sales.
• Unsold inventory of uncompleted private residential units (excluding ECs) rose significantly in Q1 2024 to 19,936 units from 16,929 units in Q4 2023. Including completed units, unsold inventory likewise increased by 17% from 17,262 units in Q4 2023 to 20,204 units in Q1 2024.
o While unsold inventory is still significantly lower than the last peak of 37,799 units recorded in Q1 2019, the ramp up in GLS confirmed list supply appears to be trickling into the market, coupled with the slowdown in developer sales over the past two years. At 20,204 units, this implies more than two years’ of landbank based on the 5-year annual average new home sales (2019 – 2023) of 9,288 units.
• Rentals of private residential properties fell for a second consecutive quarter in Q1 2024. Based on the URA Rental Index for all private residential properties, rents declined 1.9% q-o-q in Q1 2024, consistent with the 2.1% fall in Q4 2023 on the back of abundant completions in 2023.
o Q1 2024’s rental decline was led by landed properties which fell 4.2% q-o-q after the 4.1% q-o-q decrease in Q4 2023 while non-landed properties observed a more moderate decline of 1.6% q-o-q following 1.8% q-o-q fall in Q4 2023. By market segment, non-landed RCR rents led the decline, down by 1.9% q-o-q, followed by the CCR and OCR which posted falls of 1.6% and 1.4% q-o-q respectively.
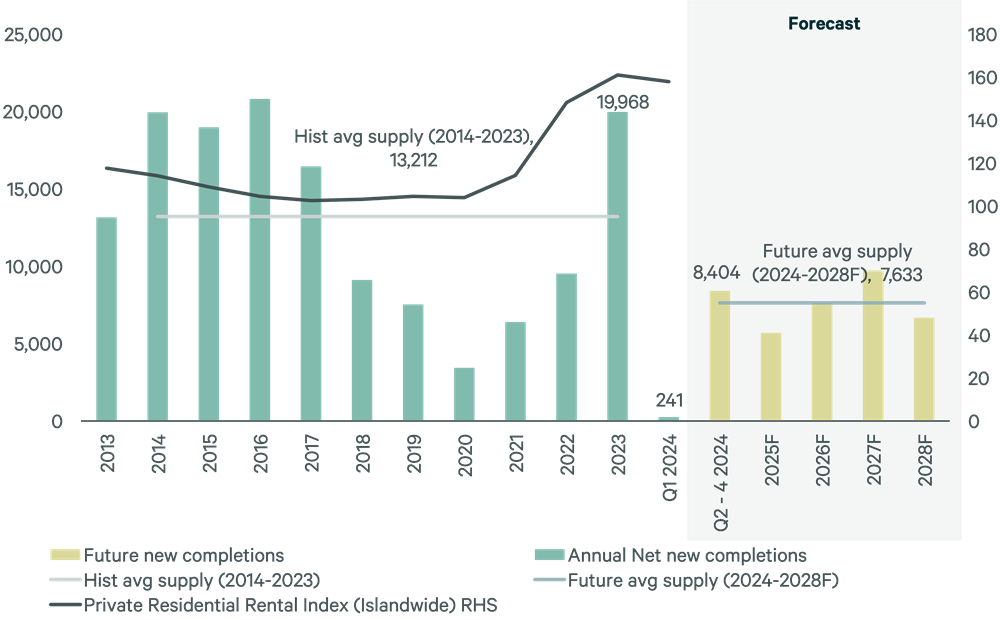
o 19,968 private homes (excluding ECs) were completed in 2023, the largest number of completions since 20,803 units in 2016. The bulk of completions (8,517 units) were recorded in Q3 2023. As a result of the bumper completions, vacancy had spiked, resulting in rentals easing since Q4 2023. In Q1 2024, only 241 units were completed -- mainly the 200-unit Meyer Mansion, and net completed stock actually shrunk by 188 units, probably due to demolishing of projects sold for redevelopment. The stock of occupied private residential units (excluding ECs) increased by 5,423 units in Q1 2024, compared with the increase of 4,926 units in the previous quarter. As a result, the vacancy rate of completed private residential units (excluding ECs) decreased to 6.8% as at end of Q1 2024, from 8.1% in the previous quarter.
o Vacancy rates of completed private residential properties as at the end of Q1 2024 in CCR, RCR and OCR were 8.9%, 6.6% and 6.0% respectively, compared with the 9.8%, 8.1% and 7.4% in the previous quarter.
o Completions should taper off in 2024 and 2025, with 8,404 and 5,700 private homes completing in Q2-Q4 2024 and full year 2025 respectively. While demand appears to be resilient, rents should ease across the market while the market digests the higher supply from peak 2023 completions. In particular, with still elevated vacancy and substantial completions in 2024, CCR should see more rental pressure in 2024.
Chart 1: Historical and future private home completions (excl. ECs)
Source: URA, CBRE Research
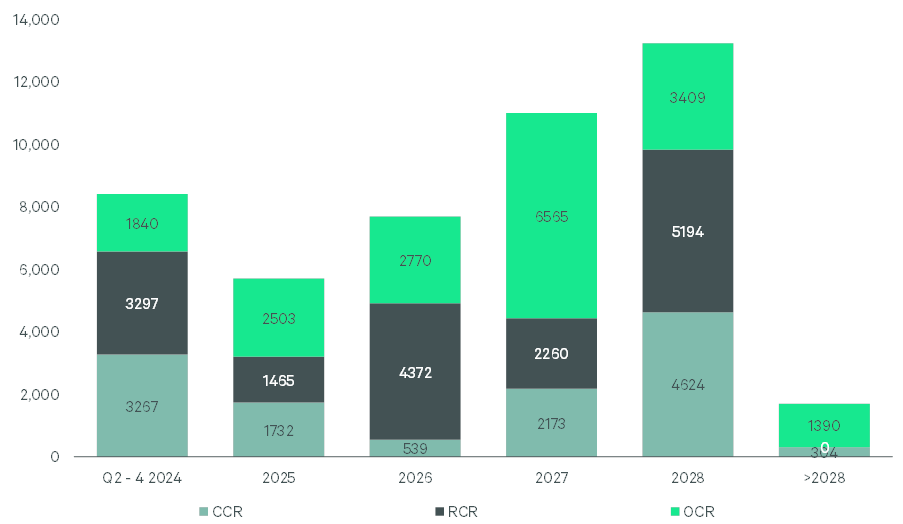
Chart 2: Pipeline of future private home completions (excl. ECs) by market segment and year of completion
Outlook
• Looking ahead, CBRE Research is cautiously optimistic on the private residential market in 2024. The current tentative buying sentiment is expected to stretch into H1 2024 amid still-high interest rates and uncertain economic conditions but sentiment could improve in H2 2024 if interest rates ease and the economy recovers. Overall, CBRE Research expects 7,000 – 8,000 new private homes to be sold in 2023, an improvement from the 6,421 units in 2023 but still below the 5-year average new developer sales across 2019 – 2023 of 9,288 units.
• Rents have fallen a cumulative 4% for two straight quarters and is now 52.1% above the pandemic lows in Q3 2020. With supply catching up in 2023 and rising vacancies, we expect rents to continue easing over the next few quarters. However, rents are unlikely to fall back to pre-2022 levels, due to increased property taxes, higher prices (requiring higher returns), higher mortgage payments from higher interest rates, and higher rental demand from the newly imposed 15-month wait-out period for downgraders (buying resale HDB) under Sep 2022’s round of cooling measures. We expect rents to ease 1-3% in 2024, led by the CCR or prime segment due to higher vacancy and supply completions.
• Private residential prices which are up 1.4% in Q1 2024 could rise at a slower pace in Q2 2024 before picking up again in H2 2024 if interest rates fall and the economy recovers. CBRE Research maintains our price forecast at 3 – 4% in 2024. A significant correction is not expected given still-low unemployment rate, resilient household balance sheets, and low unsold inventory.
Read the URA press release here.
About CBRE Group, Inc.
CBRE Group, Inc. (NYSE:CBRE), a Fortune 500 and S&P 500 company headquartered in Dallas, is the world’s largest commercial real estate services and investment firm (based on 2024 revenue). The company has more than 140,000 employees (including Turner & Townsend employees) serving clients in more than 100 countries. CBRE serves clients through four business segments: Advisory (leasing, sales, debt origination, mortgage servicing, valuations); Building Operations & Experience (facilities management, property management, flex space & experience, digital infrastructure services); Project Management (program management, project management, cost consulting); Real Estate Investments (investment management, development). Please visit our website at www.cbre.com.